Data Analytics & Visualization
Overview
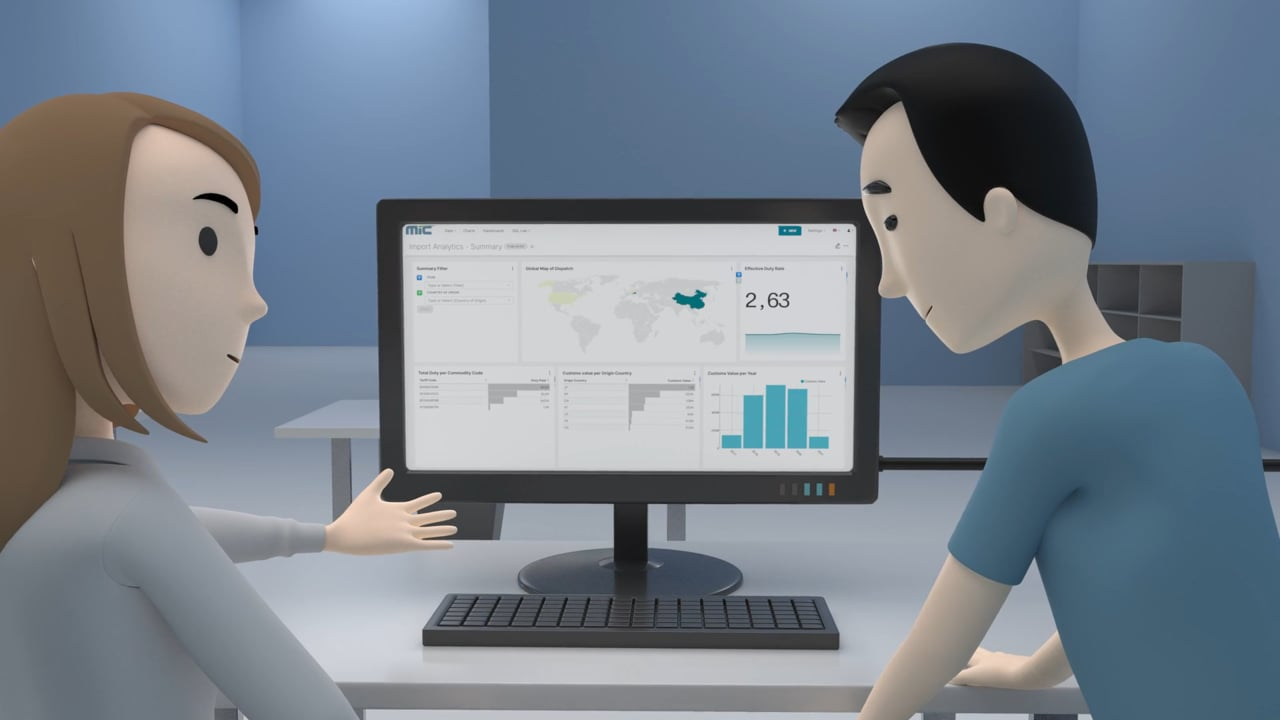
Data Analytics & Visualization is a core requirement for internationally operating companies to leverage their typically large amounts of data to identify patterns, trends, new opportunities, and problem areas across global compliance processes. The MIC Data Analytics & Visualization solution integrates the best of data management and analytics capabilities to support businesses in making intelligent and comprehensible data-driven decisions.
The MIC Data Analytics & Visualization solution provides valuable insights and knowledge to an organization that are essential for it to successfully discover, monitor, and analyze valuable information about the business and its operations.
By providing such insights, the MIC Data Analytics & Visualization solution aims to enable businesses to interpret data smarter, make better decisions and optimize their worldwide customs processes. It really is a must-have capability in any modern customs software package, because it enables businesses to leverage customs-related data to detect data inconsistencies and mitigate compliance risk. It also helps businesses to identify new optimization potentials. The ultimate goal is to provide businesses with the ability to easily analyze and visualize meaningful data.
What does MIC Data Analytics & Visualization consist of?
So far within MIC we used tools and techniques such as reporting and business intelligence to analyze data and gain insight into a business. The fundamental difference between these two analysis tools is that while reporting simply presents data to you, business intelligence gives you the ability to interact with that data and create visualizations that considerably outperform the capabilities of standard reporting.
The MIC Analytics Stack is optimized for large data volumes as well as fast and responsive insight into data. It enables flexible and efficient ETL (Extract, Transform and Load) processing of data to perform analytics and data visualization on the available datasets. Included features are:
- Datasets: The solution provides pre-defined module specific datasets for various data flows (e.g. import, export) from different sources (MIC GTM but also external sources possible). For example, an import dataset contains information about the importer, imported goods, invoice, supplier, declarant, price, transportation, duties & taxes, fees and much more.
- ETL (Extract, Transform and Load): Collects, translates and transforms data from different sources (e.g. Authority Reports, Broker Declaration Data, MIC GTM, Internal IT-Systems) into readable language according to WCO, EU and specific data sets. In context with trade content such as customs tariffs and free trade agreements, these data sets are enriched and transformed into valuable information.
- Data Serving API: RESTful API allows you to integrate the data into your own ERP system, BI tool or reporting tool by using pre-defined datasets. Data can also be exported in various file formats (e.g. CSV, JSON).
- Business Intelligence: The embedded web-based Apache Superset BI tool supports the creation of charts & dashboards and visualization of data. It comes with predefined analytics queries based on the available datasets, as well as predefined charts & dashboards. A highly intuitive user interface allows end users to easily make individual adjustments. Superset provides a security model which allows even a Row Level Security (definition of access rights for a specific user or role on a specific dataset).
- Professional Services: In case you need an individual Analytics solution based on the MIC technology stack, we offer our professional experience to find the right solution for you.
Easy to start with
The MIC Data Analytics & Visualization module can be run integrated with the various MIC modules, but also stand-alone. It’s therefore a perfect starting point for gaining visibility into an organization’s global customs processes. The system is offered as a SaaS (Software-as-a-Service) solution. It enables fast and easy access to dashboards, reports, and key metrics.
Minimize static reporting
and deliver solutions appropriate to the use case
Improve decision making
thanks to market behavior identification based on relevant business data
Identify compliance risks
as well as potential savings and trends
Get valuable insights
of your business in time


